As my fourth semester was just wrapping up, I was getting ready to take a few much needed weeks off before work and unwind just a little bit. Two days after my last final, however, I found out about Chia. Needless to say, I guess I never got to stop!
Fortunately for me and many other homelab and mining enthusiasts, farming Chia is a lot of fun. And by fun, I mean spending ludacris amounts of money on enterprise hardware that we would otherwise never have an excuse to buy. It is for this reason I have enjoyed the past few weeks of running around. Sure, I didn’t exactly get to drop everything, and I didn’t exactly get a jump start on some of my other projects, but it has been a ton of fun embarking on this IT-fueled plotting and farming journey. Anyways, the focus of this post is about plotting. In particular, plotting on old SAS hard drives and what kind of yield you can expect.
The Hardware
I’m doing my best to avoid storytelling here, so I’ll get straight to the details. Here’s the system I had on hand (cries in no more gaming):
- Ryzen 5 3600
- 24GB 3200MHz DDR4 Ram
- An old GT210 (not important)
The morning after finding out about Chia, I frantically bought 4x10TB external hard drives for $20/TB (still early enough), and also bought a single 1TB inland premium nvme m.2 ssd. However, after seeing SlothTech’s video, I eventually decided to go down the rabbit hole of plotting on hard drives. I landed on this model for a few reasons:
- This option was sustainable. Drives don’t have an absolute life. Sure, most of the drives I ordered arrived virtually on the brink of death, but a few bad-sector repairs later with e2fsck and I was off to the races.
- This option was economical. Even if my drives fail, there is a MASSIVE surplus of these on eBay. You can get a 300GB 10K SAS drive for ~$14, and 15K’s for not much more. Bottom line: it’s probably cheaper to replace these drives as the fail over time than to burn through brand new SSDs.
- This option was scalable. No, I’m not trying to get 80+ plots/day, but with this model, you could much more affordably. Buy a couple of 2.5" disk shelves or server with 2.5" hot swap bays, buy a few more HBA’s, and you’re in business.
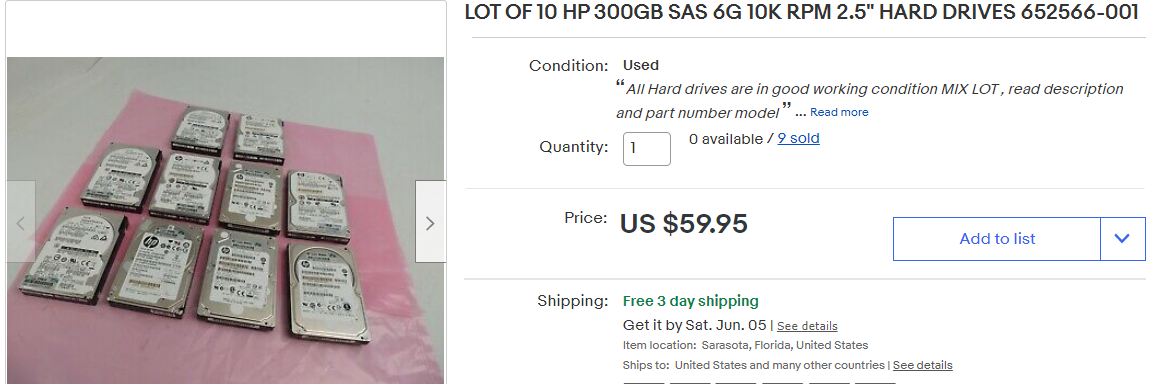
The Plotting Drives
Ultimately, I ended up ordering a lot of 10 300GB 10K SAS drives (HP). Most of these drives have 50+ thousand hours on them, and I’ve had two already crap out on me (they need some attention). BUT, sticking with the idea above, it would be cheaper to replace them as they die than to use that inland nvme I bought earlier. Starting off, I got away with spending only $6 per drive. Also, note that I chose 300GB drives as the temp size of a given plot won’t exceed 256GB (roughly around there), so 300GB will be the optimal size.
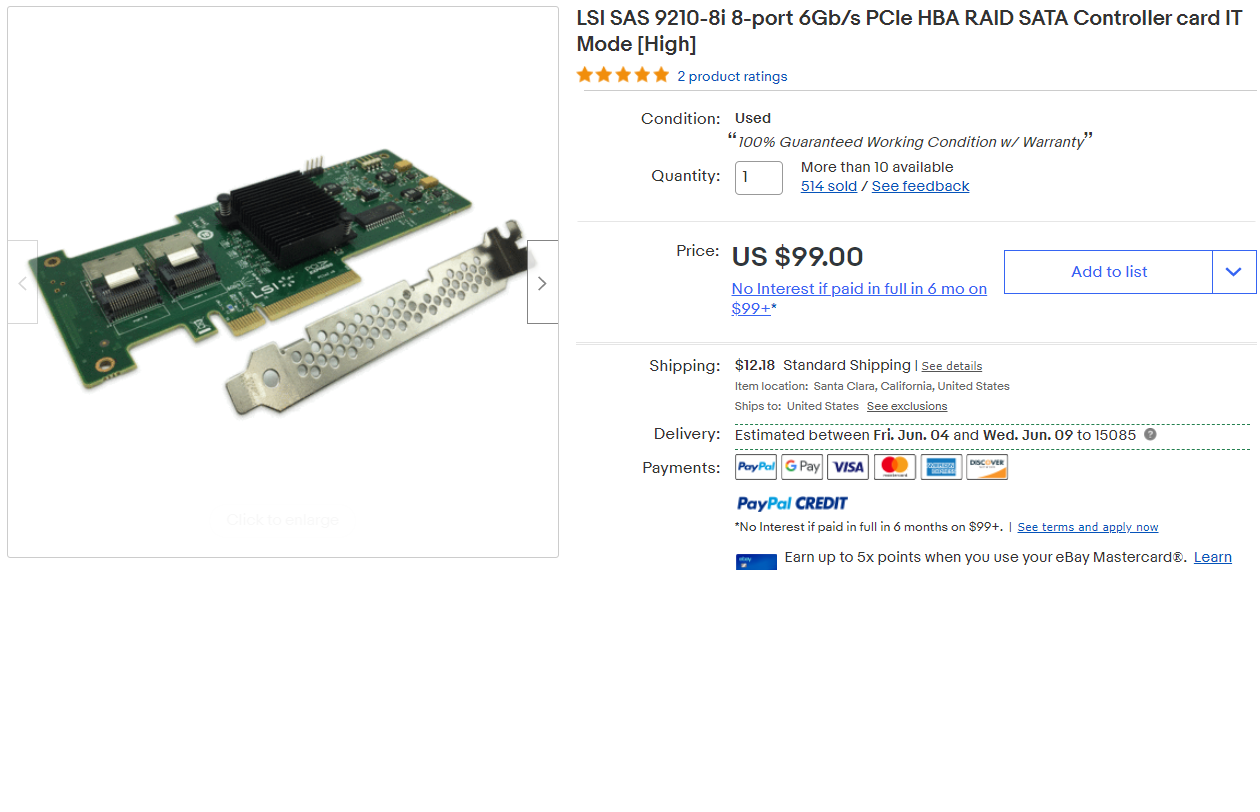
HBA and Adapters
To get these drives onto my machine, I ended up going with an LSI-9210-8i.
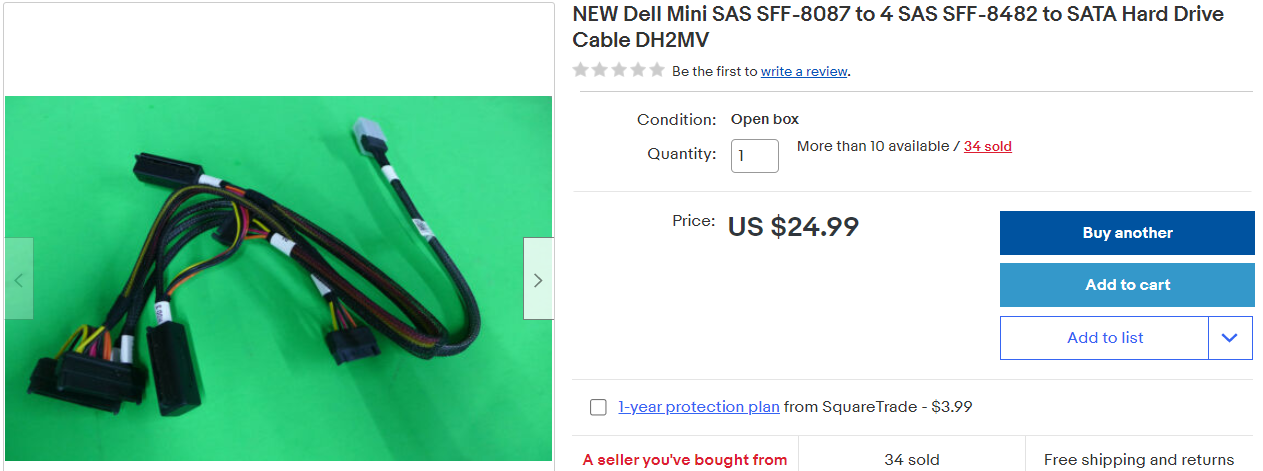
 This gave me two SAS SFF-8087 ports, each of which I could expand to 4 SFF-8482 to connect the drives to. I used two of these second-hand Dell Adapters, as the popularized options were becoming very hard to find.
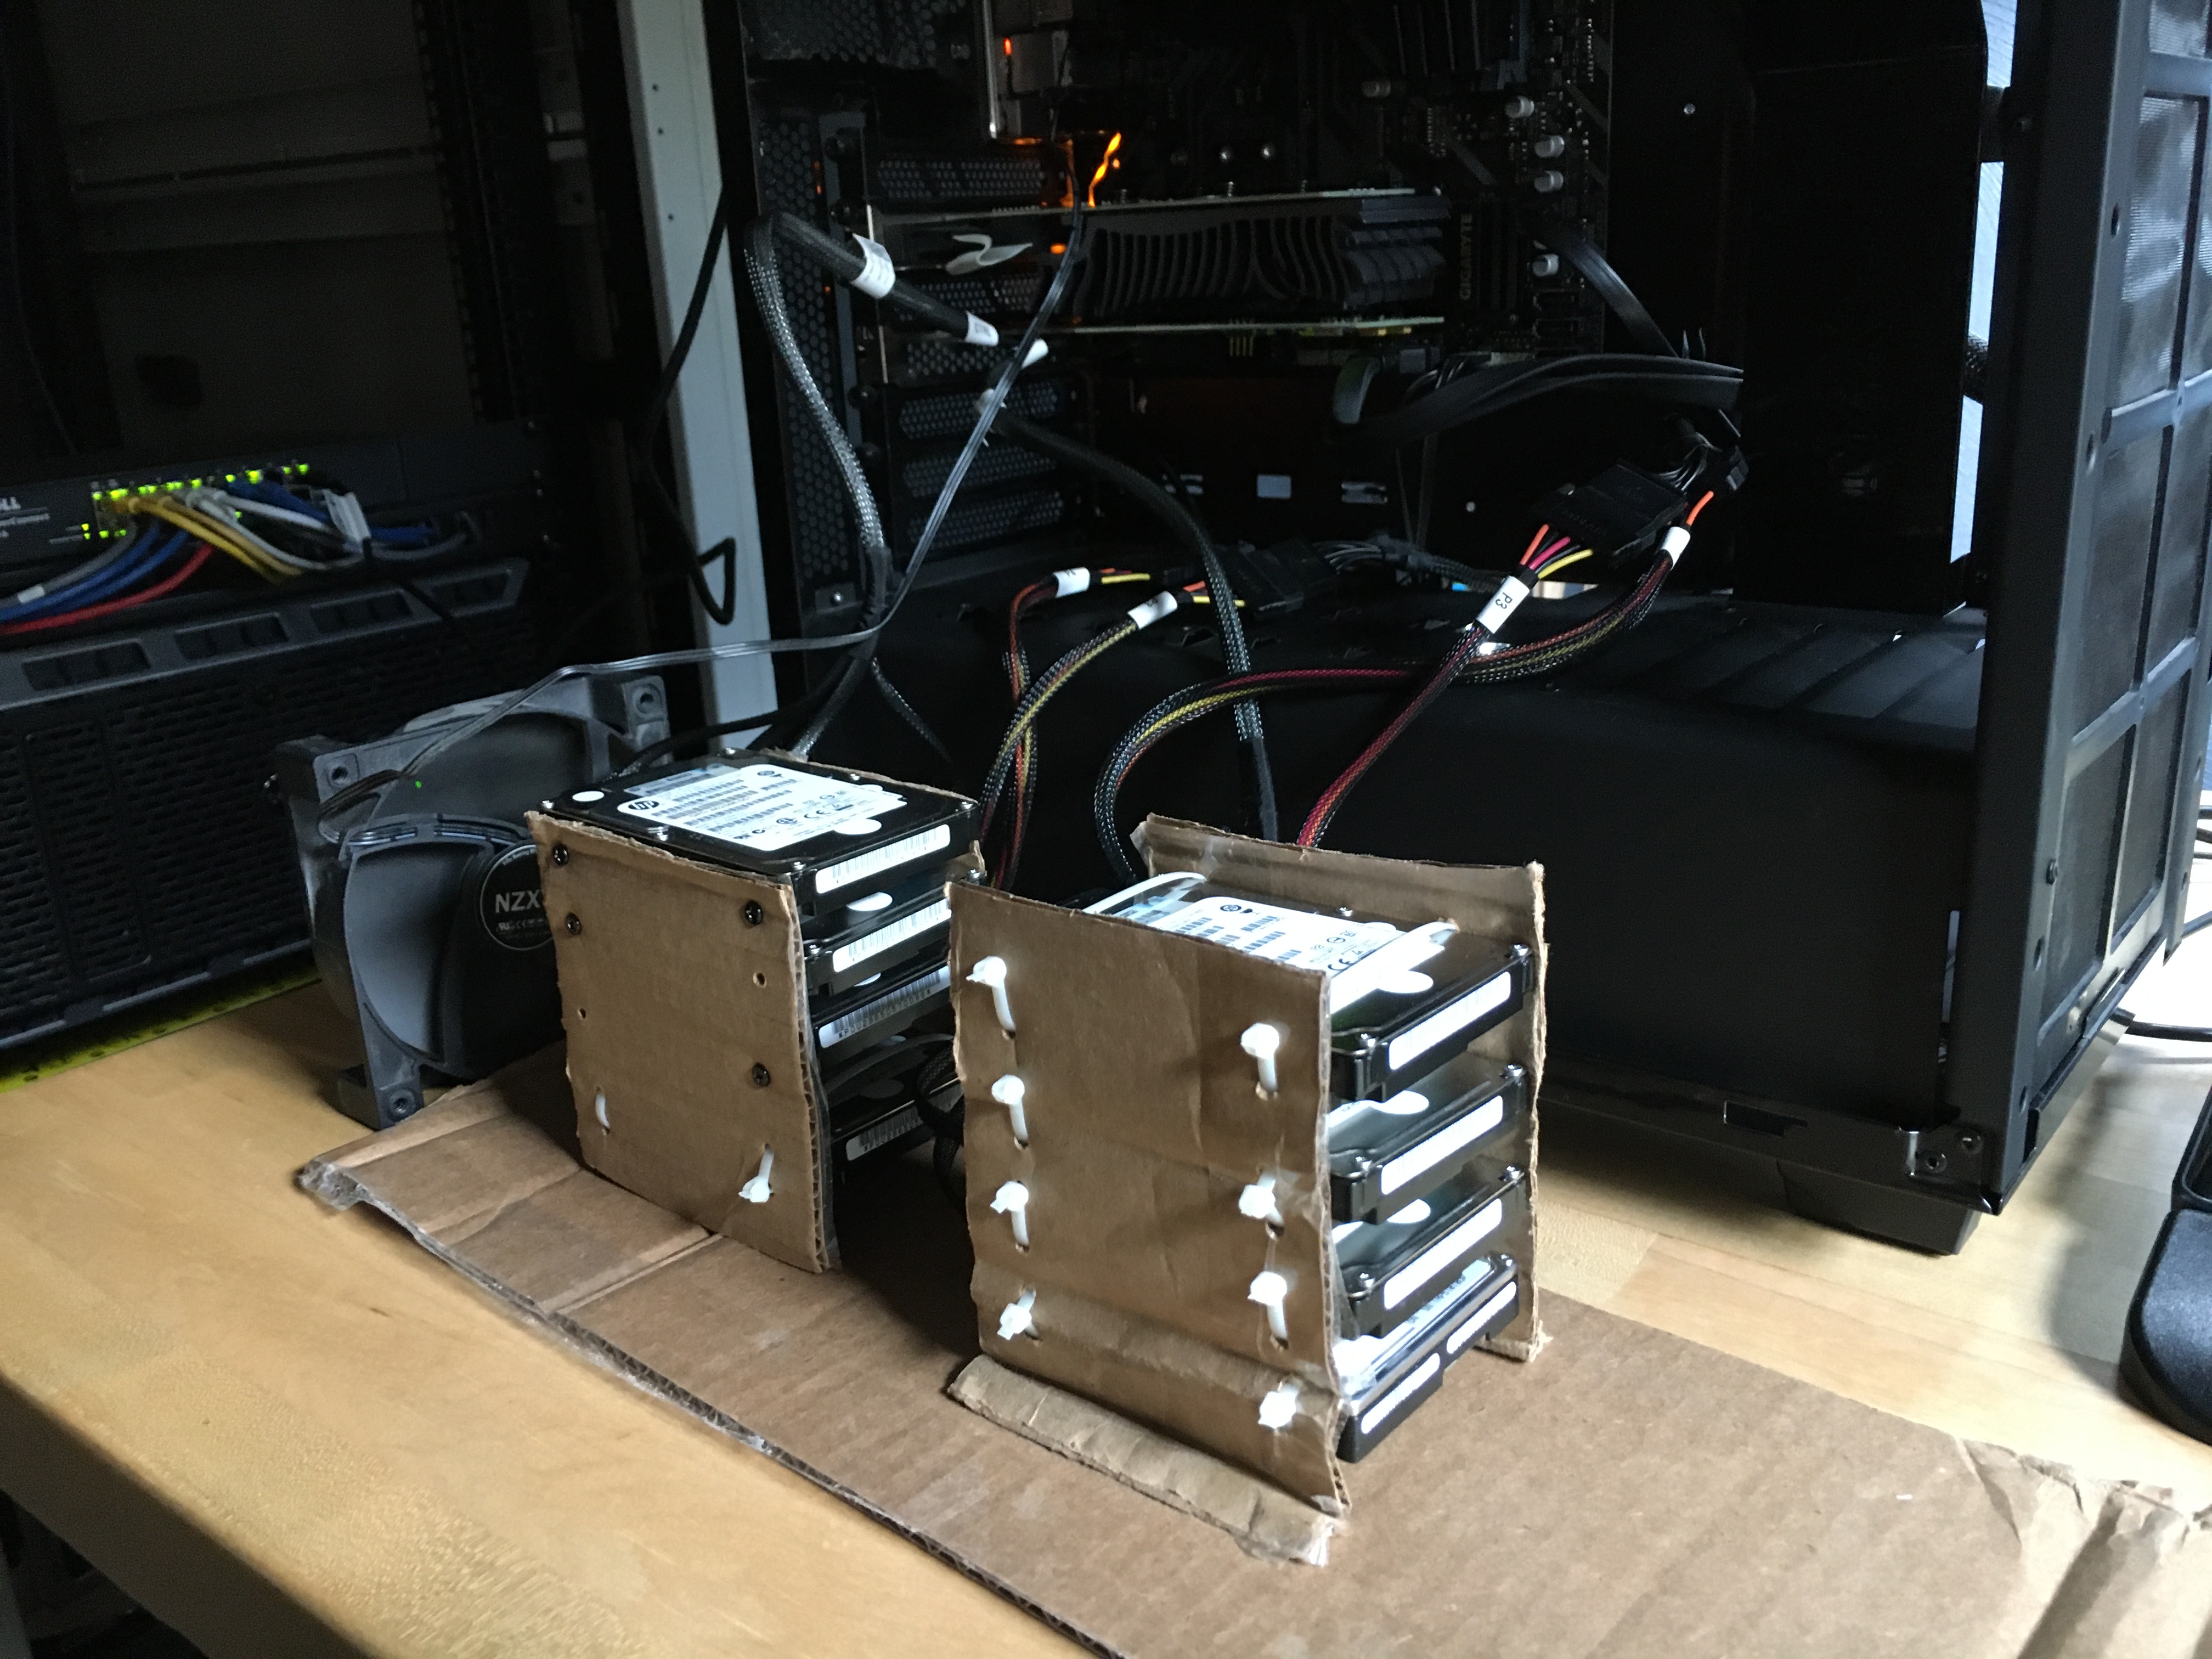
I filled the 2nd and only remaining PCIEx16 slot of my mATX B450 motherboard with the 9210-8i, and connected up my drives. This is what the setup looks like today:
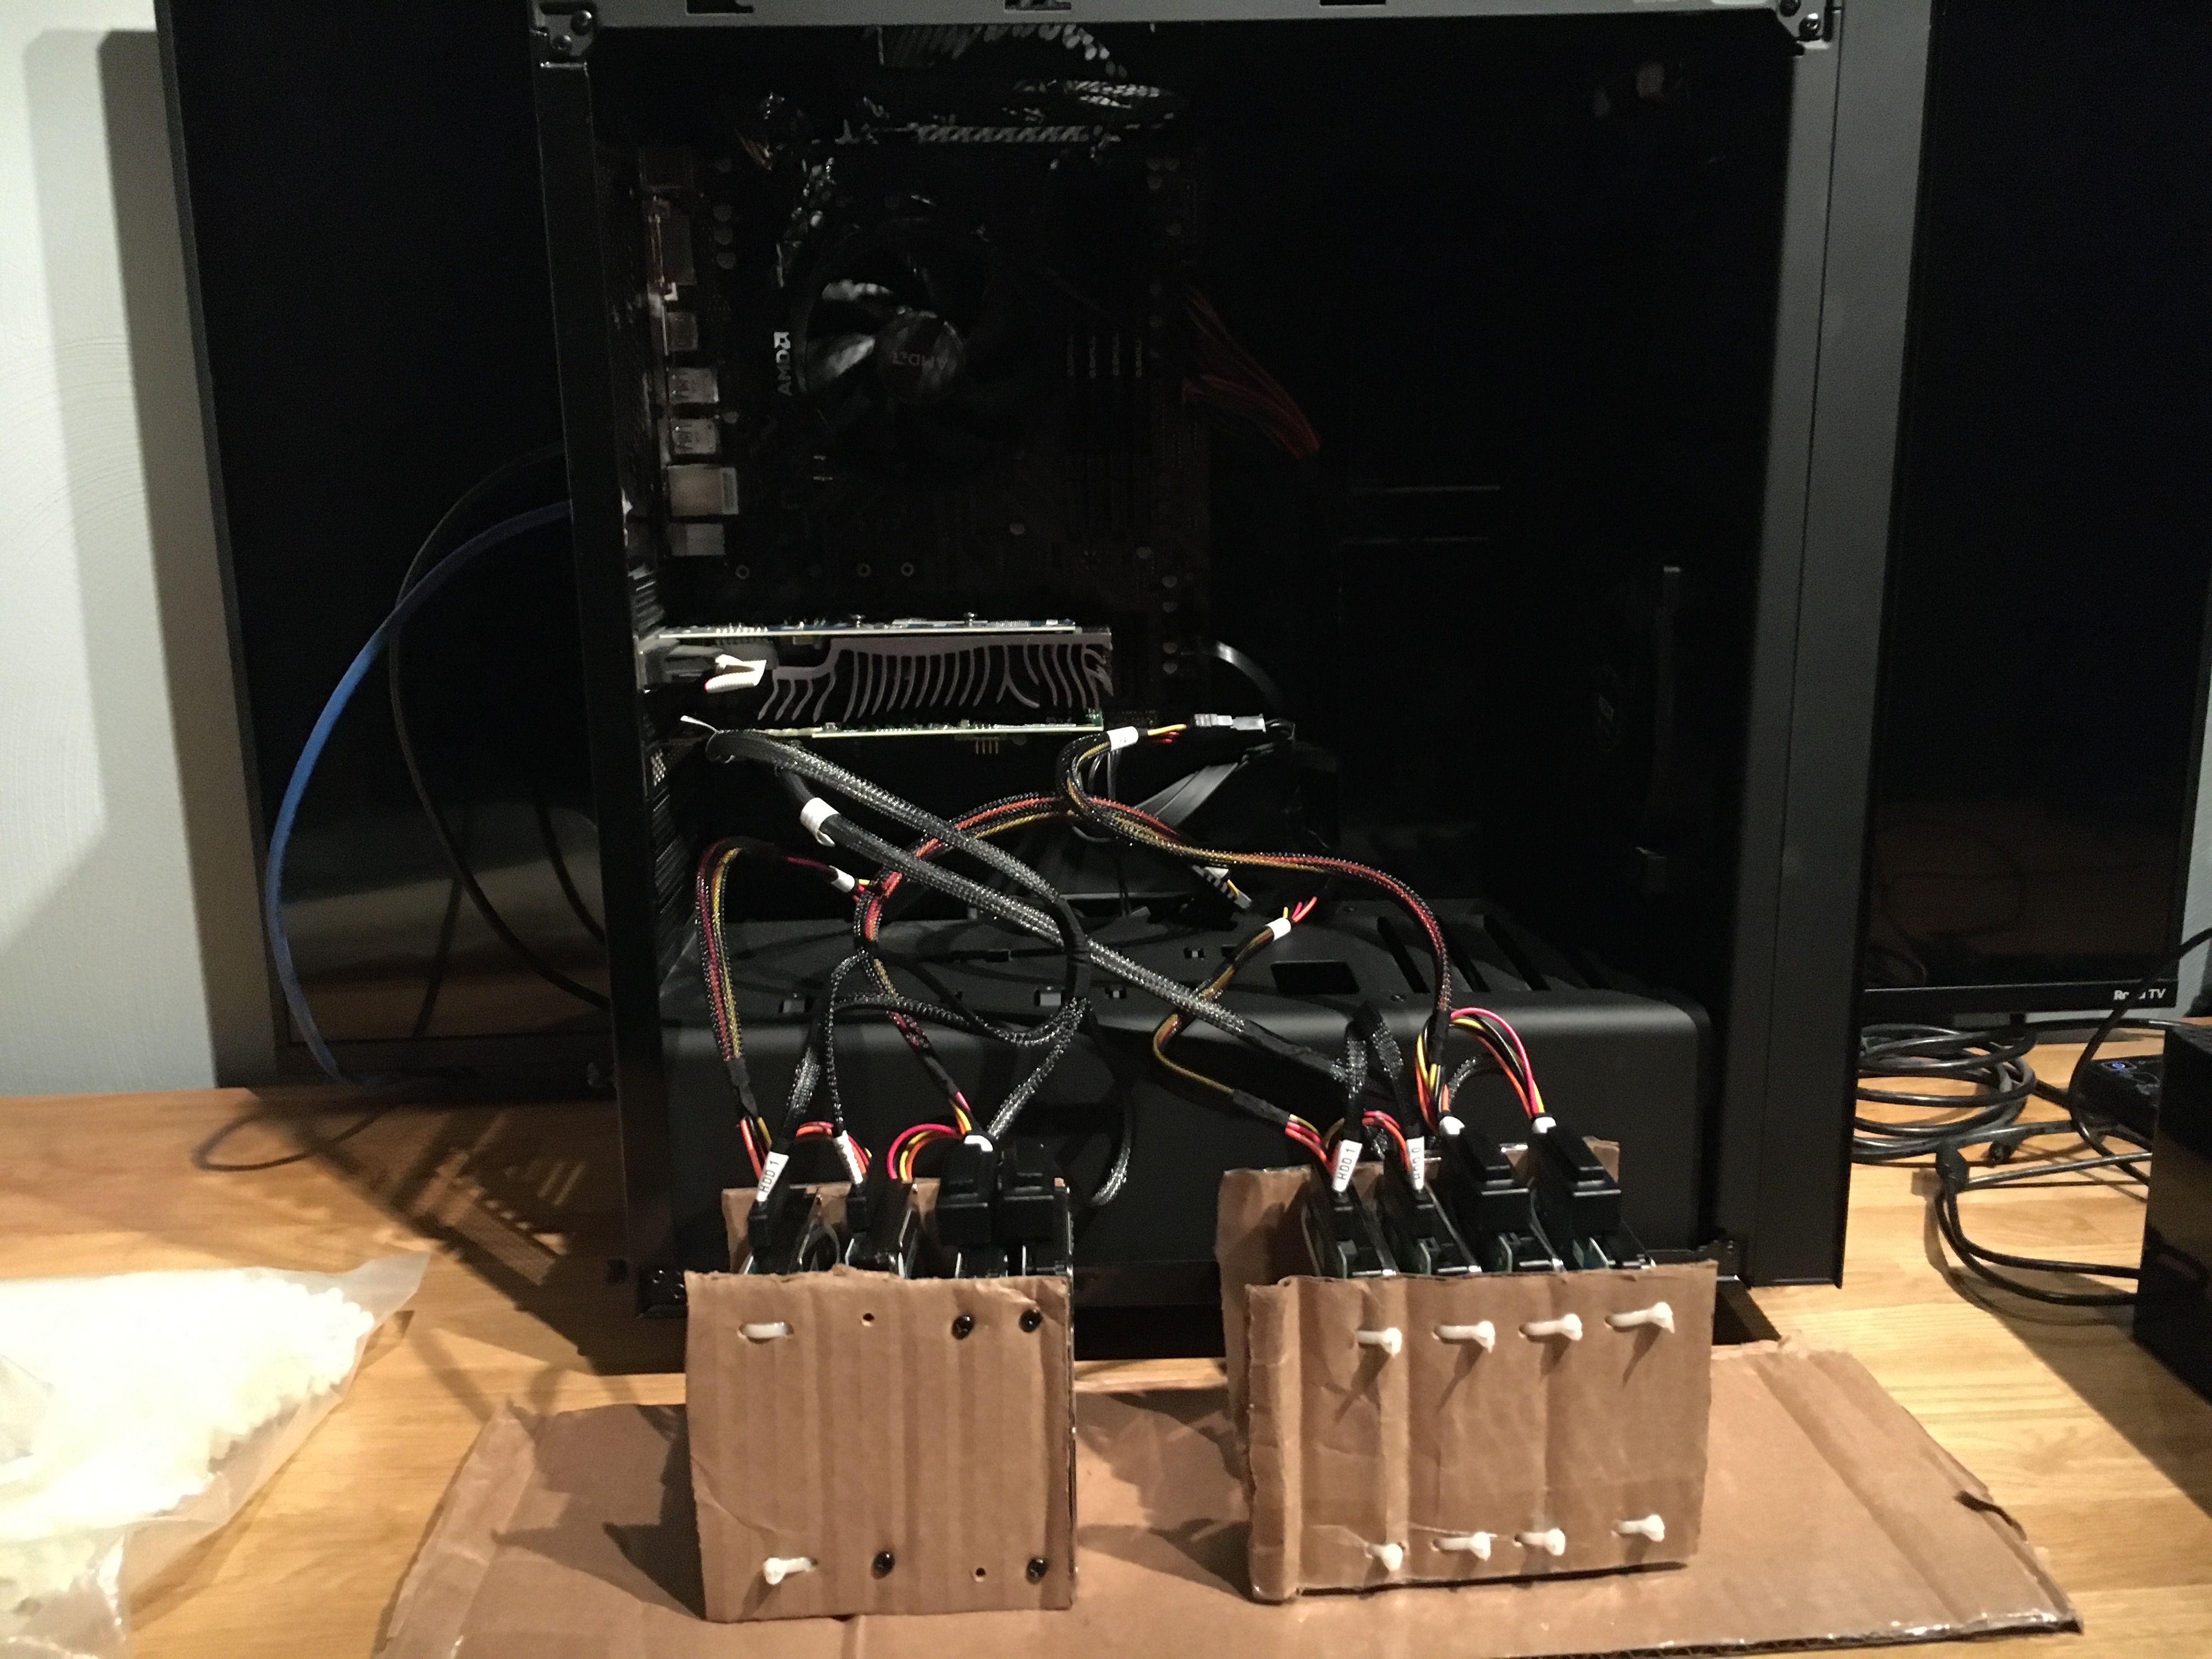
I know, I know. It’s a little, well….cardboard. This was my in-a-pinch solution for organizing the drives. In an upcoming post, I’ll go over my newest solution, but for now, this is what we’ve to work with. Today, I just have the drives upright and a big desktop blowing over them to keep them nice and cool.
Beyond these, I just have my farming drives connected via USB for now until I get my DS4246 setup, and that’s essentially it for the hardware department.
The Software
While I was waiting for all the hardware to arrive, I began pourin through Chia discord servers and YouTube videos to begin my optimization research, if I can call it that (ha!). Anyways, the general report was that most people saw a 10% performance increase when plotting on a *nix OS vs Windows. Feeling like I needed to warm up my Linux skills once again, I saw this as an opportunity to learn some more and decided I’d set up my plotting machine on Ubuntu 20.04. Yeah, I could’ve done just Ubuntu-server, but I initially didn’t want to have to think about using Chia without the GUI (silly, I know. Got over that pretty quick).
As for the plotting itself, I decided to use Swar’s Plot Manager. A lot of people seem to like plotman as well, but I decided to go with the cross-platform option just for kicks. Plus it seems like there was a lot more support for Swar in the Discord servers I was in.
Now for what we all actually care about!
My First Attempt At Plotting on Rust
Soooo, my first attempt at this turned out to be more of an experiment than I realized. See, I bought these drives thinking that the only natural solution was to setup an mdadm RAID 0 and get some substantial write speed. And well, that was pretty true. I set the drives up in a RAID 0 with mdadm and created ran XFS on top of the array (I also tested with EXT4 on the array with basically the same results). Running a 10GB DD test, the array managed to write at 1.6GB/s. Not bad! However, this isn’t quite the case for plotting.
While I don’t personally know enough about this to go into any substantial detail, what an Admin in SlothTech’s Discord explained was that with this many disks in a RAID0, plotting essentially caused more effectively random writes, rather than sequential. Again, that’s probably fairly poor phrasing, but nonetheless an inherent flaw of such a setup.
This didn’t discourage me from testing it first, however. To my own surprise, the array didn’t do half bad! Below are the plot times that I saw.
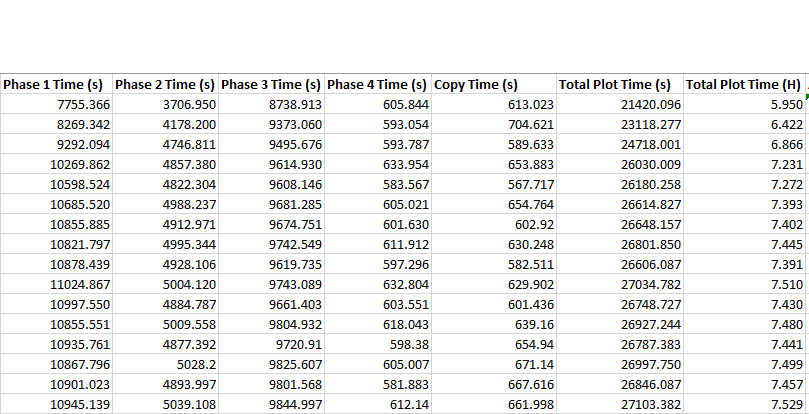
For those unaquainted, getting this kind of performance out of $10 drives is…pretty great. It was very encouraging to see these kinds of results early on. Despite what we knew about the inherent flaw of running a RAID0, my setup was doing something right.
HOWEVER, it wasn’t quite that simple.
My Problems With 10K Drives in RAID 0
See, though I got a stable 16 plots out of this RAID setup, it wasn’t long before one of these decaying drives decided to start throwing sector errors. To be honest, I had no idea what was going on at first. I just knew that all of my plots were reporting that they
Only read 43984 of 262130 bytes at offset 593462320 from "/mnt/md0/plot-k32-2021-05-25-22-18-7c60eb1983721f2d8c8ee35e5ded7a0098e5fa13aa05d8604c4d7af24f2e5b50.plot.p1.t5.sort_bucket_087.tmp" with length 738436336. Error 1. Retrying in five minutes.
Only read 43984 of 262130 bytes at offset 593462320 from "/mnt/md0/plot-k32-2021-05-25-22-18-7c60eb1983721f2d8c8ee35e5ded7a0098e5fa13aa05d8604c4d7af24f2e5b50.plot.p1.t5.sort_bucket_087.tmp" with length 738436336. Error 1. Retrying in five minutes.
Scratching my head, I did some searching, and most people getting the same error were told that it was because they ran out of space. Well, that wasn’t quite the problem for me, I had plenty of room left. Reading further, others said that an “ERROR 1” (what this was) was due to a problem with the temporary disk. It was at this point that I did some digging and eventually noticed in the syslog this error showing up around the same time my plots failed:
critical medium error, dev sdc, sector 312500636 op 0x0:(READ) flags 0x80000 phys_seg 77 prio class 0
Critical medium error??? Well, I eventually figured out that this was due to bad sectors on the disk. I figured there had to be some way to tell the host to just exclude/ignore said bad sectors, and as it turns out, there was! I followed this guide to help sort things out, and it seemed fix things up.
Well, sort of. It’s not that e2fsck didn’t work (to my knowledge), but rather anytime ANY disk had an issue, all of my concurrent plots basically tanked. Breakup the array, unmount the broken disk, fix the partition, rinse and repeat. Again, I’m a noobie, so I’m sure I could’ve been missing some life-changing detail along the way, but this kept happening. I kept losing plots, and I couldn’t finish any benchmarks I was doing. I wasn’t so much getting discouraged as much as I was fed up with faulty disks and how bad they were behaving in this array.
Again, I could definitely be to blame here. But I really think whatever was going on was just too much to deal with when all of the drives I would be buying could be just as faulty. If a disk fails? No problem! But I don’t want to lose all my plots. This is ultimately what turned me off of this configuration of the 10K disks. Additionally, though, despite plot times being faster, I wasn’t able to run as many in parallel as a I was when plotting individually, and I ended up getting better, more consistent performance individually after testing.
Plotting Individually
Ah yes, here at last. I didn’t realize this is what Alex from Sloth Tech was doing when he first made his video (I must’ve glossed straight over those details). Regardless, this is what has ultimately performed most optimally for me and my setup. The logic is as follows:
- Despite having slower temporary drives, you can basically (not always) have as many concurrent plots as you have drives, just so long as you have the threads and Memory to back the jobs up. Soooooo, higher core count Xeon CPUS, some old ECC DDR3 ram, and a whole bunch of SAS HDD’s is the perfect recipe for lots of plots in parallel! Because the disks are the bottleneck, the only way you’ll max out your CPU and Memory is by adding more drives and subsequent plots!
- Though plots will take a lot longer to complete, you can complete a whole lot more concurrently than lower capacity or lower drive count setups like you might see with higher speed temporary storage solutions (like NVME drives or even my RAID 0 setup).
- And, if you lose a disk, then only one plot is affected!
All of these points in mind, I used fdisk to create new partitions on each drive, setup EXT4 on each drive’s partition, and then mounted each drive to /mnt/plot1, /mntplot2, etc, etc (and eventually remembered to add these mounts to fstab).
Now, I had to figure out how to get this setup in SWAR.
Don’t Do This
Now initially I didn’t set this up correctly. I tried to use only a SINGLE job in Swar’s config and listed the eight mountpoints under the temporary directory. The trouble with this that if plots start finishing in odd orders, or if you lose a disk, or any number of things don’t go EXACTLY how they’re supposed to, SWAR will try to start another plot on a drive that is already being plotted with. This fails because
- That drive is going to run out of space in no time (My drives are only 279.8GB)
- The write speed to that drive is going to drop to a screeching halt. Not literally, but it’ll take twice as long (if not more) to plot two on the same drive. Bad idea, easily avoided, don’t do it.
Probably The Best Route
If you’re plotting with 10K/15K drives, unless you’ve found success with multiple RAID0’s between two disks and so forth, this is probably the approach you’ll want to take.
Basically, I created a job for each drive. That is, for those still learning, you’ll want to add a new configuration to the config under jobs for each SAS drive you’re using for plotting. Each job you set up should allow no more than 1 concurrent plot at a time. This way, only a single plot will be created on the disk of that job, rather than multiple. I also set the max for phase 1 to 1, but that technically shouldn’t be necessary.
Now, in order to avoid a bottleneck in the copy phase (phase 5), I had to consider the amount of time that would need to pass between the various jobs. Because stagger time only dicates the amonut of time a job must wait between it’s own plots, it is useless in this case. Instead, I stagger the jobs by setting their initial_delay_minutes. If I want the plots of the different jobs to be staggered by 60 minutes, then I set the initial delay of each job to a multiple of 60, beginning with 0. This ultimately staggers the plots of the different jobs like so:

This is important so that the Copy Phase (phase 5) doesn’t bottleneck your entire pipeline. Though the max time I recorded for the copy phase was about 12 minutes, I can’t set my stagger to 12 minutes. In a perfect world, sure. In reality, however, plots don’t always take the same amount of time. 60 minutes of cushion was what I could afford and it has yielded the smoothest results. If you’re running more concurrently, you might eventually end up bumping this down I’d imagine, but again, that’s all for testing.
Also, I made a claim earlier that you can basically run as many concurrent plotting jobs as you have drives, and I think this will be true for 90% of people. At least in my experience, because the disk is your bottleneck, even if you don’t technically have enough threads (2 per plot), I’ve found that it hasn’t made a difference in my experience (with my 6 core 12 thread Ryzen). Additionally, for those same reasons, I have only been running my plots with 2300MB of memory. Again, no issues. This could be another baseless claim, but this is what has worked in my setup. So, in my case, I was able to set a global max_concurrent of 8 and a max_for_phase_1 of 8 without issue.
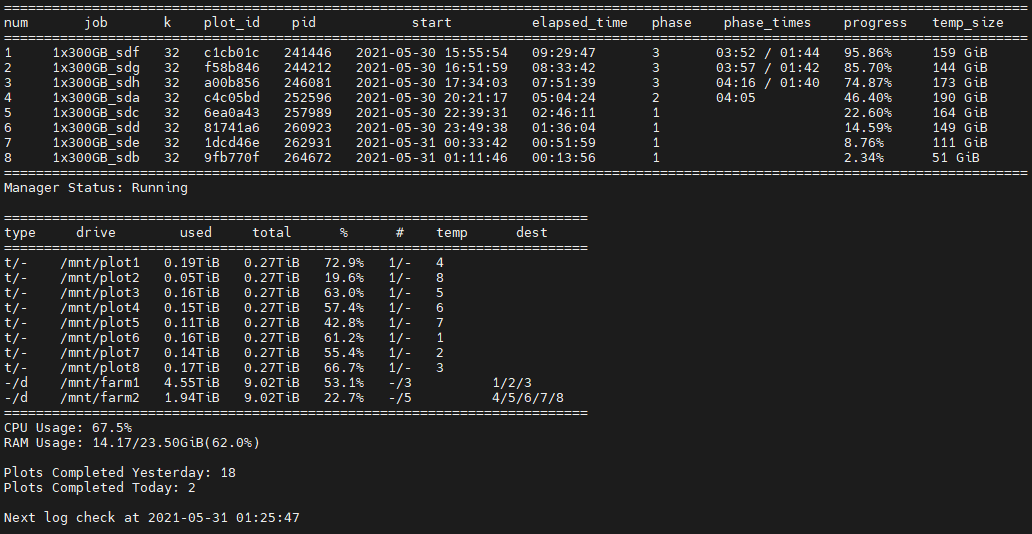
With all of this said, my system was able to do 18 plots today, and I’m thinking it might be able to do 19 tomorrow. I still have some playing around to do, but so far this is what I’ve gotten to:
I definitely may have brushed over some details here, so I’m attaching my current config.yaml for anyone curious. If you’re getting started or want to see what’s up with this setup, hopefully that will get you the answers you’re looking for.
Observations
While I don’t have a whole book for this section, myself and a few others from Sloth Tech’s Discord Server (which at this point, I should have linked. Here it is) couldn’t help but notice that some of my plot times were a fair bit less than those with similar machines. What differed mainly between our machines was the CPU and memory technology. I’m not a memory expert, so I can’t really say how much of an impact DDR4 ram had vs their DDR3, but I was more inclined to think that the single core performance of our CPU’s was what ultimately was accontable for that difference. With the same disks, it seemed to be the only obvious variable that had really changed, so perhaps more testing will be done to see how big of a difference it really is. In truth, our tests weren’t more than maybe 45 minutes off, so I doubt it’s that big a of deal. It does mean that there is perhaps slightly more at play than just the bottleneck of the slow disks.
Future Improvements/Tests
These are just some notable tests that myself or other users from the Discord have been talking about doing with SAS hard drives.
Sata SSD Temporary2 Device
While I haven’t personally implemented this, a certain PaulB from the Discord found that using a 512GB (or so) Sata SSD as a temporary2 device in combination with his 10K drives helped to shave off almost two hours worth of plot time! Now, whether the improvements are this aggressive in every case, I don’t know yet. It is however a promising improvement that I may look into implementing myself.
One possible red flag is: “SSD? I thought we wanted to avoid burning through those!” Absolutely. However, the Temp2 directory doesn’t experience the same volume of writes that the main temporary directories do. Rather, I believe only the size of the plot (or maybe less) gets written to the temp2 device per plot. I need to check my facts on that point, but nonetheless, lower endurance, lower speed SSD’s are more than equipped to handle this simple improvement.
Extra Memory? Decrease Bucket Size
Another user was discussing how, by decreasing the bucket size, you’re effectively decreasing the number of lookups that need to be performed on the slower 10K hard disk. The cost, however, is that a plot will need just about twice as much ram then. If you have some extra overhead, though, this could be a very good way to speed things up. This is a pretty useless claim without any quantitative data yet, but I’ll be keeping my eye out for those testing and see what happens.
My (2nd) Dell Poweredge T420
I caved. The setup you see pictured above is what I am starting with. However, I had to come to terms with reality: I’m still a student, I’ll be working shortly, and I just won’t have as much time to babysit or put up with the nuances of my cardboard-based solution. Not that it’s toppling over every ten minutes or anything, but it’s just kind of a pain.
- I run a loud fan to keep the drives cool
- I basically lost my second desk to that whole setup
- I don’t have another UPS for my current plotter all the way over there.
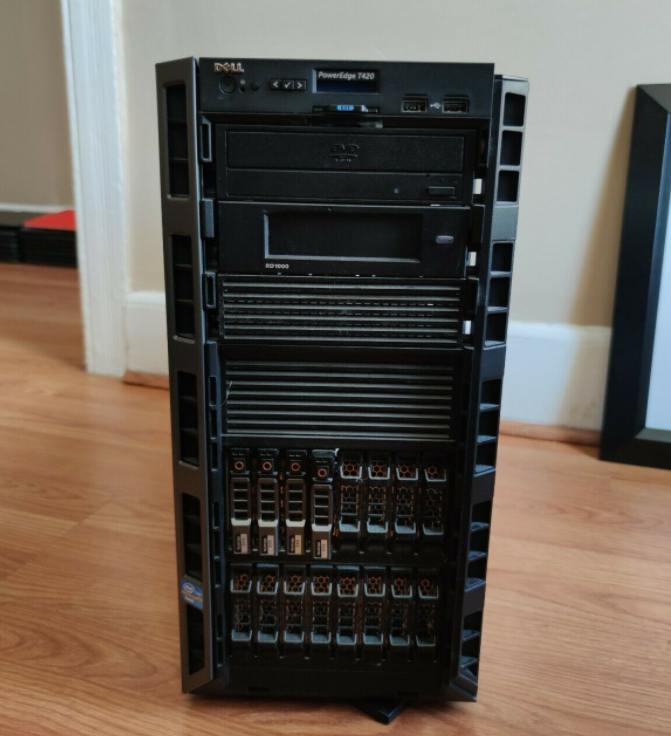
Not to mention, I have an entire 40U of server rack sitting next to me. With my brother also conveniently looking to ugprade his gaming PC to something more like what I’m plotting on, I agreed to sell it to him. With this money, another Dell Poweredge T420 will end up in my rack.
Despite albeit less single core performance from the E5-2450 V2’s I’m putting in it, this T420 has room for 16 2.5" drives, so I can just scale up and not notice it anyways. More importantly, though, this solution just makes more sense for me. I can easily connect my disk shelf to it, all of the plotting drives are easily accessible and uniformly maintained, and everything is battery backed up and contained neatly in my rack. It’s scalable, economical, and makes the most sense for me. I do have a few qualms with the T420, but in this instance, I think it’ll be just what I’ve been looking for. Updates to come…